

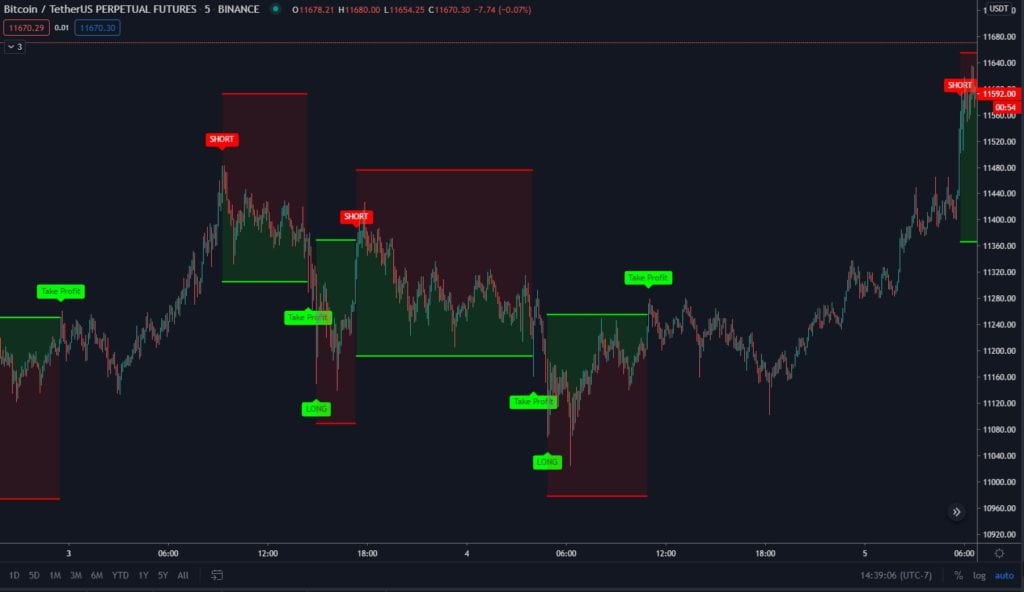
Divergence Hunter Indicator
This strategy is based on price divergences from moving averages on low or high time frames. ABSOLUTELY NO REPAINTING!


Decision Making Indicators
Noise Cancelling Filters
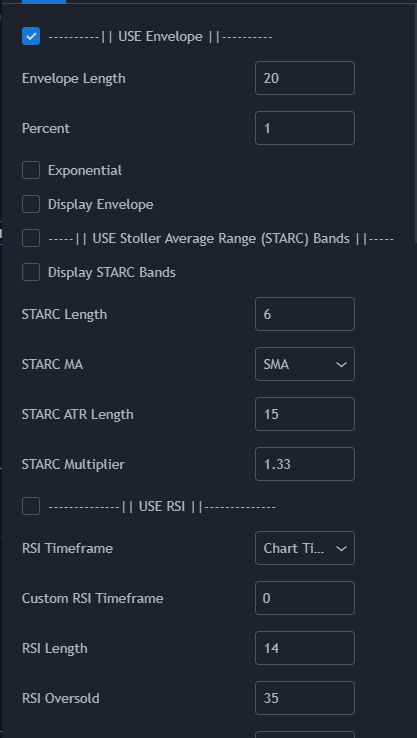
- Envelope
- STARC Bands
- RSI
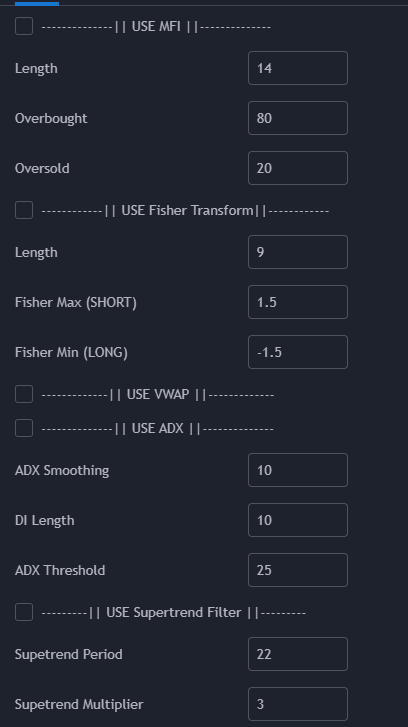
- MFI
- Fisher Transform
- VWAP
- ADX
- SuperTrend Filter
- Moving Average Filter
- MACD Filter
These indicators are actually broken into two different categories within itself which makes the strategy so versatile.
Envelope and STARC bands are overlays on the chart that measure the volatility of the market.
RSI, MFI and Fisher are great oscillators. They all perform different in different market conditions which gives the trader the ability to choose and pick from.
RSI does well in sideways while MFI does better during a volatile market.
These noise cancelling filters act as a filter to get rid of the unprofitable signals generated during sideways market.
VWAP, MA Filter and SuperTrend are also overlays on the chart that tracks the average price based on different calculations.
While ADX only measures the strength of the trend and does not look at the average price.
MACD also helps pick break out points.